Air pollution
Dirty air, PM2.5, smog
In 2025 the sensor network counted 214 days in Yerevan on which fine PM2.5 particles exceeded the WHO daily guideline, with an annual mean of 28 µg/m³ against a recommended 5. There is no state PM2.5 data: the two stations bought for it have been on trial since January 2026, and a limit for these particles takes effect in November 2027. No study showing what this pollution is made up of has been published.
Facts checked
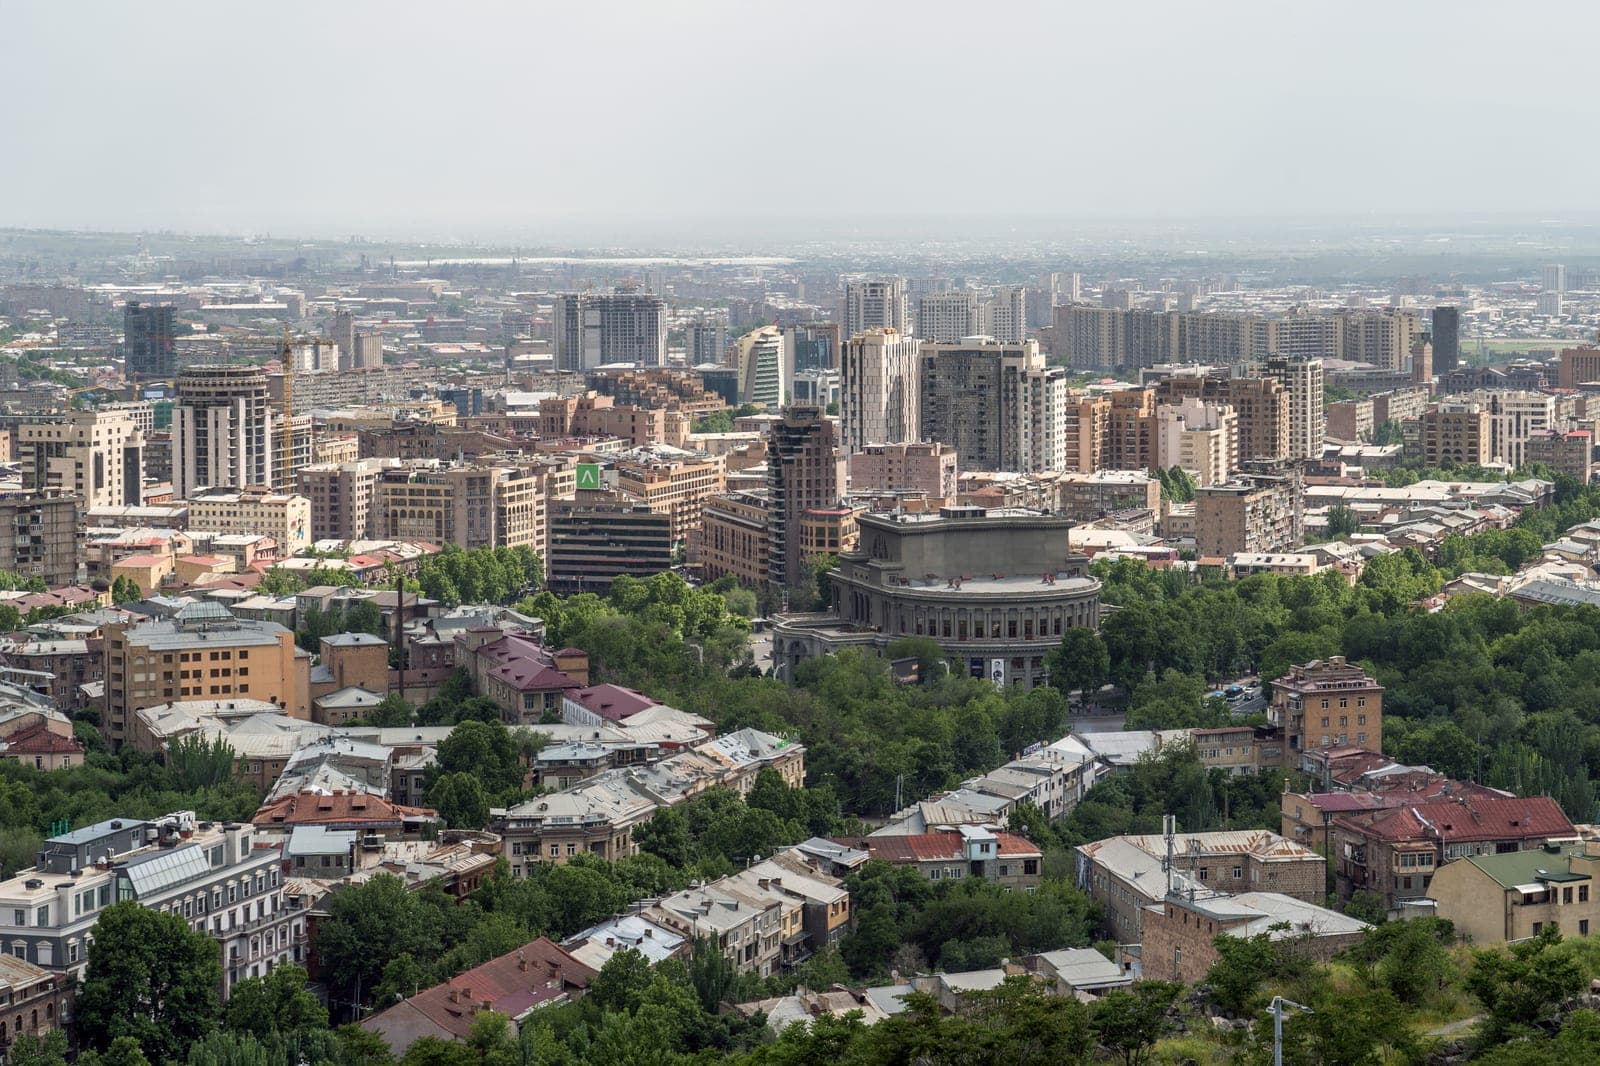
Photo: Alexkom000 · Wikimedia Commons · CC BY 4.0
How it began
Before. Yerevan sits in a basin. On its floor, as a meteorologist wrote in 1975, calms and weak winds prevail, and temperature inversions are frequent in the cold half of the year. From 1919 to 1943 the city averaged 26 foggy days a year.
What changed. After the war, chemical plants and an aluminium plant grew up in and next to the city, and foggy days more than doubled. By 2000 the enterprises' emissions had fallen by orders of magnitude, but dust in the air stayed above the limit.
On the sanitary protection of atmospheric air — Журнал экспериментальной и клинической медицины АН Армянской ССР, 1967
Air Quality Management Feasibility Study for Armenia: Final Report — NILU, 2011
Environmental Performance Reviews: Armenia — UNECE, 2000
Timeline
- Decision
Tamanyan's plan puts industry in the south, because the wind blows away from the city
Alexander Tamanyan placed the industrial zone south and south-east of the residential city. An architectural historian in 1960 quoted his reasoning: this protects the city 'from dust and soot, bearing in mind that Yerevan's prevailing winds blow from north to south'. A 1968 paper read something else off the wind roses: the wind blows from the north and north-east in summer, while in winter the rare, weak winds come from the south and south-west.
- Origin
A synthetic rubber plant opens next to Yerevan
The future Nairit, called the Kirov plant in Soviet papers, was built outside the city. By 1968 the city had grown out to it: in winter the rare, weak winds blew, as meteorologists described it, 'from the Kirov plant toward the city'.
- Development
A hygienist reports more than twice as many foggy days and fluorosis among Arabkir children
From 1919 to 1943 Yerevan averaged 26 foggy days a year; after the war, 'with the rapid growth of industry', the number more than doubled. Fog and emissions cut ultraviolet radiation by about 40%. The Kanaz aluminium plant emitted fluorine, and signs of fluorosis were recorded among children in Arabkir.
- Development
Measurements put fluoride gases near the aluminium plant at 51 times the limit
The 1968 paper cites fluoride measurements that hygienists published in 1958: by the maximum readings, fluoride gases exceeded the permitted concentration 51 times over at 500 metres from Kanaz, 7.6 times at two kilometres and 5.6 times at four. Daily mean chloroprene in winter ran up to 20 times the limit. The authors put the winter peaks down to inversion: pollutants stagnate in the layer next to the ground.
- Development
A meteorologist describes the basin: calms, inversions and 'dense smogs'
'On the floor of the basin, where cold air drains by gravity and a "lake of cold" forms, calms and weak winds prevail', and temperature inversions are frequent in the cold half of the year. On fog the author is direct: in and around Yerevan it often takes 'the character of dense smogs that harm the health of the population'.
- Development
The weather service's posts find dust above the limit in every season
At two fixed posts, in observations for separate years between April 1971 and April 1976, the monthly mean dust concentration ranged from 0.3 to 2.0 mg/m³ and stayed above the permitted level in every season. The highest single reading, 7.4 mg/m³, fell in October 1976. The paper puts the summer peak down to natural dust, some of it carried from the deserts of northern Arabia; in winter dust depended mainly on industry and transport under calm air and inversions.
- Development
An economist counts the sources: 250 enterprises, 700 boiler houses, 70,000 vehicles
Yerevan held almost 250 industrial enterprises, about 700 heating boiler houses and more than 70,000 motor vehicles; almost all the enterprises, the chemical ones above all, stood within the city limits. The city's general plan, the author wrote, did not provide for solving social problems together, clean air among them. Public green space per resident was down to 9 m², to about a third of the pre-war figure.
- Development
Chloroprene above the limit in housing within 7 km of the plant
According to Nairit's own laboratory and the city sanitary service, chloroprene concentrations in residential areas within 7 km 'significantly exceed the permitted ones'. Doctors examined 837 people: among men working at the plant, combined bronchial and lung morbidity was 44.2%, significantly above the rate at two neighbouring enterprises.
- Development
Doctors find chronic bronchitis 2.5 times as common in Yerevan as in the village of Dsegh
Having examined 1,776 adults in the city and a village, doctors found chronic bronchitis in 10.9% of Yerevan residents and 4.4% in the village of Dsegh. The 26 Commissars district, in the upper, greener part of the city, had 4.8%; the Myasnikyan and Ordzhonikidze districts, which the authors call the center, had 15.8%. With the other risk factors equal, the authors put the difference down, 'evidently', to the city's dirtier air; the study did not measure the air itself.
- Development
The last year of industry at full output: dust at three times the limit
Daily mean concentrations in Yerevan, from the Ministry of Nature Protection: suspended particles 0.5 mg/m³ against a limit of 0.15, carbon monoxide 7 against 3, nitrogen oxides 0.12 against 0.04, sulphur dioxide 0.14 against 0.05. In 1988-1991 lead in Yerevan and Alaverdi ran at 10-16 times its limit.
- Civic action
Three thousand people demand the closure of a chemical plant and the nuclear station
On 17 October, according to an Associated Press report printed by the Boston Globe and relayed by the newspaper Asbarez, 3,000 people demonstrated in Yerevan, demanding that a chemical plant and the Metsamor nuclear station be closed for polluting the environment; the historian Pietro Shakarian, citing a later book, gives 4,000. The march started at the Opera and was led by the writers Silva Kaputikyan, Zori Balayan and Maro Margaryan. The day before, Literaturnaya Gazeta had printed Balayan's article on Yerevan's air. Moscow sent a scientific commission, which proposed closing half of Nairit.
- Development
Snow in Yerevan proves the most polluted in the republic
In snow samples from two winters, 1987-1988 and 1988-1989, the mineral content of meltwater in Yerevan reached 290 mg/l against a background of 30-40 mg/l in the high mountains. The study's author called the Yerevan pollution source the strongest in Armenia: emissions from chemical plants, heat and power plants, building-materials works and motor transport polluted the air of the whole Ararat valley. Nor Nork, Nork and Zeytun, 300-400 metres above the center, often lay above the inversion layer, and the snow there was cleaner.
- Decision
The Supreme Council of the Armenian SSR decides to stop Nairit
The decision was taken on 25 June 1989. Two years later, on 17 April 1991, it was annulled, and the Supreme Council of the Republic of Armenia resolved to restart the plant.
- Development
Yerevan has more nitrogen dioxide in its air than any other Soviet city
According to State Committee for Hydrometeorology data for 1990, published in 1994 in the journal Global Environmental Change, the annual mean concentration of nitrogen dioxide in Yerevan was 146 µg/m³, the highest in the country, against a daily limit of 40. Carbon monoxide averaged 6,000 µg/m³, also the highest, against a limit of 3,000. Yerevan was on the list of 18 cities with the poorest air, where the annual means of three or more pollutants exceeded the daily limit; for Yerevan these were benzo(a)pyrene, suspended particles, nitric oxide and nitrogen dioxide, and the sources named were the chemical industry, power plants, non-ferrous metallurgy and transport. The authors put the high nitrogen dioxide and carbon monoxide down to transport emissions and stagnant air in a deep basin.
- Development
In the energy crisis 470 hectares of trees are cut for fuel
In 1990 trees covered about 1,930 hectares of Yerevan, 8.6% of its territory. During the crisis of 1991-1995 about 470 hectares were cut for fuel, in 1995-2000 another 700 went to construction, and by the early 2000s about 760 hectares were left. Having lost its vegetation, the city, in the judgment of the Green City plan's authors, lost its natural barrier against dust and wind.
- Development
The factories stop and the dust stays
Emissions from Yerevan's enterprises fell by orders of magnitude: sulphur dioxide from 23,269 tonnes in 1990 to 302 in 2000, dust from 3,755 to 176 tonnes. Suspended particles in the air barely moved: 0.5-0.6 mg/m³ in 1987-1990 and 0.4-0.5 in 1991-1996, against a limit of 0.15.
- Development
Lead in the air falls by two orders of magnitude
In 1995-1996 the air in Yerevan held about 0.4 µg/m³ of lead on average, mostly from leaded petrol. By 1998 unleaded petrol predominated and the concentration had dropped to 0.003 µg/m³ or less; three quarters of the lead that remained rose from soil that holds past emissions. The government banned leaded petrol in 2000.
- Development
Liver cancer among chloroprene workers runs at three times the expected rate
Cancer researchers followed 2,314 people who had worked with chloroprene at the Yerevan plant between 1940 and 1988. They had fewer cancers overall than expected, but the incidence of liver cancer in 1979-1990 was 3.27 times the expected rate (95% confidence interval 1.47-7.27). We found no study of the health of people living in the neighbouring districts.
- Decision
The government sets the limits: one for dust, none for PM10 or PM2.5
Decision N 160-N sets a daily mean limit of 0.15 mg/m³ for 'suspended particles (dust undifferentiated by composition)' and 0.04 mg/m³ for nitrogen dioxide. It has no separate limits for PM10 and PM2.5, the particles by which the WHO assesses harm to health. These limits stay in force until 1 November 2027.
- Development
Explosions at Nairit kill four
Two explosions destroyed a chloroprene storage facility; four people died and about two dozen were injured. In 2010 rubber production at the plant came to an end.
- Development
Norwegian experts find the monitoring network 'in dire need of repairs'
Yerevan had 5 continuous monitoring stations and up to 45 points sampled once a week. Dust was measured by a non-standard method that counts particles larger than 0.95 microns, so the data cannot be compared with PM10 or PM2.5. The local samplers read nitrogen dioxide 39% lower on average than the Norwegian ones.
- Development
Geochemists count 39 working quarries in the city and trace metals to plants in the south
In 2011-2012 the Center for Ecological-Noosphere Studies sampled snow, leaves and air across the city. In summer the air held 0.175 mg/m³ of dust on average, 1.16 times the limit. The authors 'presumably' tied the highest dust levels, in the north and north-east, to the working of tuff, basalt and sand: Yerevan has 39 active deposits within its limits. Metalworking plants in the south were named as the source of molybdenum, mercury and copper.
- Development
Half the children tested in Erebuni have blood lead above the reference level
Researchers at the American University of Armenia measured lead in the blood of children born in 2007-2009 in Alaverdi, Akhtala and Yerevan's Erebuni district, where two smelters operate. In Erebuni the geometric mean was 5.1 µg/dl, and 52.8% of the children were above the reference level of the U.S. Centers for Disease Control, 5 µg/dl. The risk was higher for those who lived nearer the source.
- Development
The Green City plan: Yerevan has nothing to measure fine particles with
The draft plan, prepared for City Hall with EBRD support, gives the annual mean dust concentration as 162 µg/m³. Particles of PM10 and smaller 'cannot be measured by devices used and are therefore not monitored'. The authors put the average age of a car in the city at 16 years.
- Development
Automatic measurements are discontinued for lack of spare parts
After a visit in November 2019, experts of the European Environment Agency recorded that automatic equipment had been installed and running, but that measurements were discontinued 'due to lack of proper management and spare parts'. The state network did not measure PM10 or PM2.5: it had no instruments for them.
- Media
The worst day of 2019: 153 µg/m³ of fine particles
Hetq relayed a New York Times analysis: on the most polluted day of 2019 the air in Yerevan held 153 µg/m³ of PM2.5. Moscow's worst day came to 41, Paris's to 75, Berlin's to 88 and Istanbul's to 91.
- Development
The U.S. embassy monitor reads 210 µg/m³ over a day
On 16 December the U.S. Department of State monitor at the embassy in Yerevan read 209.9 µg/m³ of PM2.5 as a daily mean, 14 times the WHO daily guideline; the airquality.am sensor network gave a city mean of 100.1 that day. The U.S. AirNow system's files hold the monitor's data for 118 days between 15 November 2022 and 20 April 2023; 23 December to 23 January is missing. On those 118 days the monitor averaged 43.5 µg/m³ and the sensor network 25.0. AirNow data are preliminary.
- Development
Geochemists describe the particles on leaves beside one kindergarten
In 2021-2024 the Center for Ecological-Noosphere Studies ran a project whose tasks include the elemental composition of PM2.5 and PM10 and the search for pollution sources. A 2023 abstract that acknowledges the project describes particles that settled in 2018 and 2019 on the leaves of a green barrier between a kindergarten and the street: of 1,915 particles 16.6% were fine and 76.6% coarse (2.5-10 microns), and by composition they are carbonates, aluminosilicates and iron oxides and hydroxides. The project page names risk maps as the result. In 2025 the project's manager, Lilit Sahakyan, explained that the center samples the surfaces on which pollutants settle, and does not sample the air directly.
Complex studies of atmospheric particulate matter, dust and associated potentially toxic elements in Yerevan: page of the 2021-2024 project — Center for Ecological-Noosphere Studies, 2021
Street dust and green barrier deposited PM particles chemical characterization and associated health risk assessment in an urban kindergarten: abstract — Goldschmidt 2023, 2023
Yerevan's Air Pollution Problem: City Authorities Contest Disturbing International Data — Hetq, February 1, 2025
- Decision
The Council of Elders requires developers to fit dust nets and sensors
Decision N 815 came into force on 1 September 2023. In mid-December the sites still had no sensors; in May 2024 they stood on 16 of more than 300 sites, in September there were 108, and 151 by the end of the year.
Sources of Atmospheric Air Pollution in Yerevan — Ecolur, September 9, 2024
Yerevan Mayor vows radical steps to reduce air pollution — Armenpress, December 23, 2024
- Development
Dust at four times the limit at a state station
The station at the Lusavorich-Agatangeghos junction read 0.57 mg/m³ of dust against a limit of 0.15. Two days later Ecolur, citing the World Air Quality Index, wrote that pollution stood at 12-16 times the WHO annual guideline. The city has five fixed stations: two in Kentron and one each in Nor Nork, Shengavit and Arabkir.
- Decision
Avinyan orders a four-year plan to be drafted within two months
The mayor named what the plan must contain: tree planting 'with concrete indicators' and restrictions, for example on ageing vehicles that 'leave behind two kilometers of smoke'. A week later City Hall reported the average air quality index from its 151 sensors: 103 in November and 140 in December. On 18 December a journalist compared readings for the three South Caucasus capitals: Yerevan's air was the worst.
- Development
The plan is presented to the mayor, with no budget and no dates
The programme was reported by Sirarpi Haykazyan, acting head of the nature protection department. In March City Hall told journalists that action plans 'with a budget and an implementation schedule' would be developed for each measure later. In April Avinyan said the programme focuses on planting evergreen trees and 'didn't rule out' a future ban on cars without catalytic converters.
Yerevan Municipality · Tigran Avinyan
Programme (strategy) for improving air quality in the city of Yerevan — Armenian Global Chronicle, March 3, 2025
- Civic action
A public discussion on air with doctors, activists and City Hall
The Yerevan for People initiative held a discussion that ran for more than three hours. A cardiologist and an oncologist described how fine particles are linked to diseases of the heart, lungs and blood vessels. The Ministry of Environment declined its invitation.
Ministry of Environment of Armenia
Event page - Decision
The government approves an air protection programme for 2025-2030
Decision N 611-L provides for new monitoring stations, dust suppression requirements for construction sites and quarries, greening, and proposals on vehicle emissions.
- Decision
Armenia's first PM2.5 limits: 25 µg/m³ a day, 10 a year
Decision N 1142-N allows no more than 18 days of exceedance a year. From 1 January 2035 the limits match the WHO guidelines: 15 µg/m³ a day and 5 a year. The start was planned for 2030; an amendment of 23 April 2026 moved it to 1 November 2027.
- Development
November smog: 118 µg/m³ of PM2.5 across the city, above 440 in places
According to Ecolur, on 26 November the PM2.5 concentration in the city reached 118 µg/m³, and over three weeks it had risen above 440 in Arinj, Bagrevand and on Paruyr Sevak Street. Two days earlier Avinyan had spoken of people heating with firewood and of 'small factories for processing leaves and rubbish' in courtyards. On 27 November the Prime Minister announced a working group on air pollution.
Tigran Avinyan · Nikol Pashinyan
Winter nears, air pollution worsens: Avinyan wants to fight leaf and waste burning — Hetq, November 24, 2025
- Civic action
A march in respirators from Republic Square to City Hall
Participants in respirators and gas masks walked from Republic Square to Freedom Square and on to City Hall, demanding clean air. One participant put their number at about two hundred; nobody from City Hall came out to meet them.
Event page - Decision
The Prime Minister creates an interdepartmental group on air
The group is chaired by Deputy Prime Minister Tigran Khachatryan. It has 24 members: five ministers, MP Mery Galstyan, deputy mayor Sargis Madatyan, the heads of the hydrometeorological center and the National Center for Disease Control and Prevention, two NGOs and two independent experts. Its head must report to the Prime Minister every 15 days and inform the public every month. At the first session on 18 December the group was shown three years of monitoring data and discussed vehicle exhaust and digital emission tests at vehicle inspection. As of 14 October 2026 that is the only report on its sessions on the government's site; by the end of May the authors of airquality.am had found no decision of the group in anything published.
Nikol Pashinyan · Government of Armenia
Prime Minister's Decision N 1145-A on creating an interdepartmental working group — ARLIS, December 10, 2025
The first session of the interdepartmental working group on atmospheric air pollution was held — Government of Armenia, December 18, 2025
Winter 25/26: a report on air quality in Yerevan — airquality.am, May 30, 2026
- Milestone
214 days in one year above the WHO daily guideline
LossFor the year, airquality.am counted 214 days on which PM2.5 exceeded 15 µg/m³; the WHO allows 3-4 such days a year. The annual mean was 28 µg/m³ against a recommended 5. These numbers cannot be set directly against earlier years: since January 2024 the network has grown from 23 to 140 stations and reached the outskirts.
- Development
The winter's worst 30 days: a mean index of 168.8
The most polluted unbroken month ran from 5 January to 3 February. Over the winter, November to March, the air was worse than the WHO daily guideline on 138 days out of 151, and on 51 days the daily mean AQI was above 150. The peak fell at 8-9 p.m.
- Decision
The Council of Elders adopts a climate plan that includes an inventory of pollution sources
Two measures in the Sustainable Energy and Climate Action Plan deal directly with air quality: to make the city's monitoring system reliable in 2026-2028, and in 2026-2030 to list and map the sources of pollution, with mineral deposits and open-air industry given as examples. City Hall, the administrative districts, NGOs and international programmes are among those named as responsible.
- Development
The American University of Armenia presents a pollution and mortality model for Yerevan
Assistant Professor Matthew Reale-Hatem described a model that estimates pollution across the city at a 100-meter resolution from data on particles, roads, vegetation, population and weather, and then calculates the added mortality with the Global Exposure Mortality Model. The university's report gives no results of the calculation.
- Development
The EU and UN agencies launch a programme that includes a source study
The three-year EU4Clean Air programme, with an EU budget of EUR 2 million, is run by UNDP, UNECE, the WHO and the Environment Agency Austria. The programme document lists a study on the sources of pollutants in Yerevan.
- Decision
The fine for construction dust rises from 70-100 thousand to 1.5-2 million drams
For a repeat violation within a year a developer pays 3-4 million drams. City Hall itself considered the old fine out of proportion to what dust protection costs.
- Update
The ministry and City Hall reply: stations on trial, no report on the plan
Answering requests from airquality.am, the Ministry of Environment said the two stations for which 300 million drams were allocated in 2025 have been on trial since January 2026; it did not say when the PM2.5 and PM10 data will be opened. City Hall wrote that 9 of the four-year programme's 14 short-term measures are done, and attached neither documents nor financial information.
Photographs
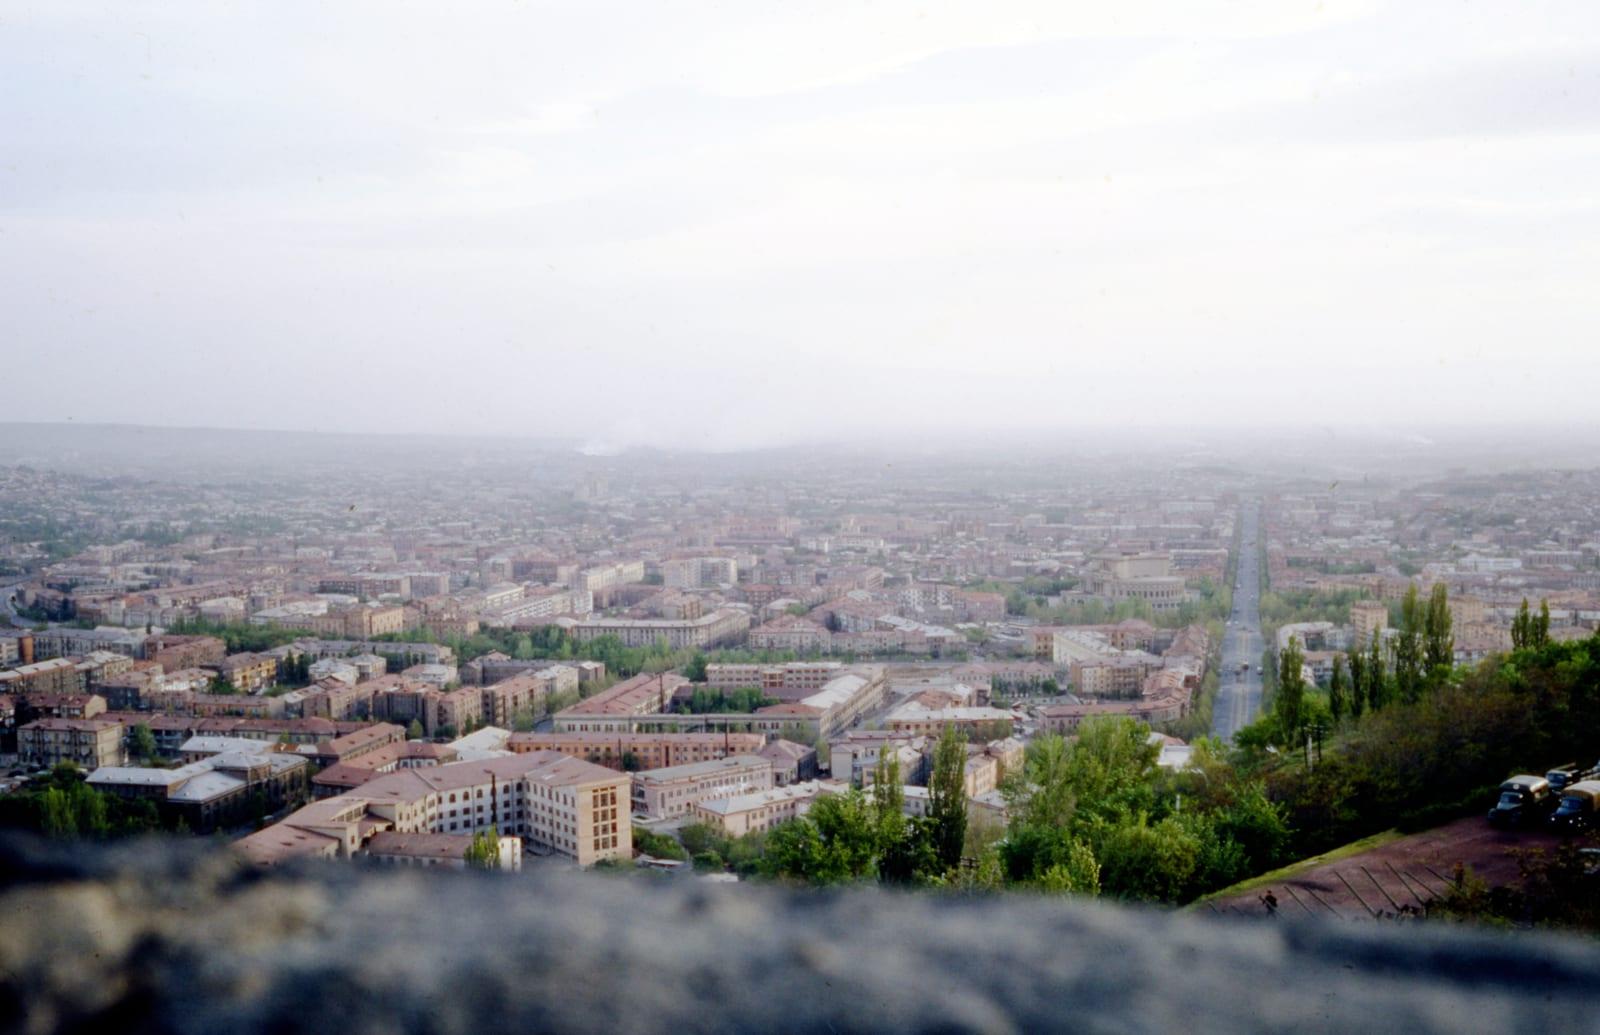
1964. Yerevan from the hill in Victory Park, a slide taken by Thomas Hammond on a trip to the Soviet Union. The day is overcast and the distance is in haze.
Photo: Thomas Taylor Hammond / University of Virginia CREEES · Wikimedia Commons · CC BY-SA 4.0
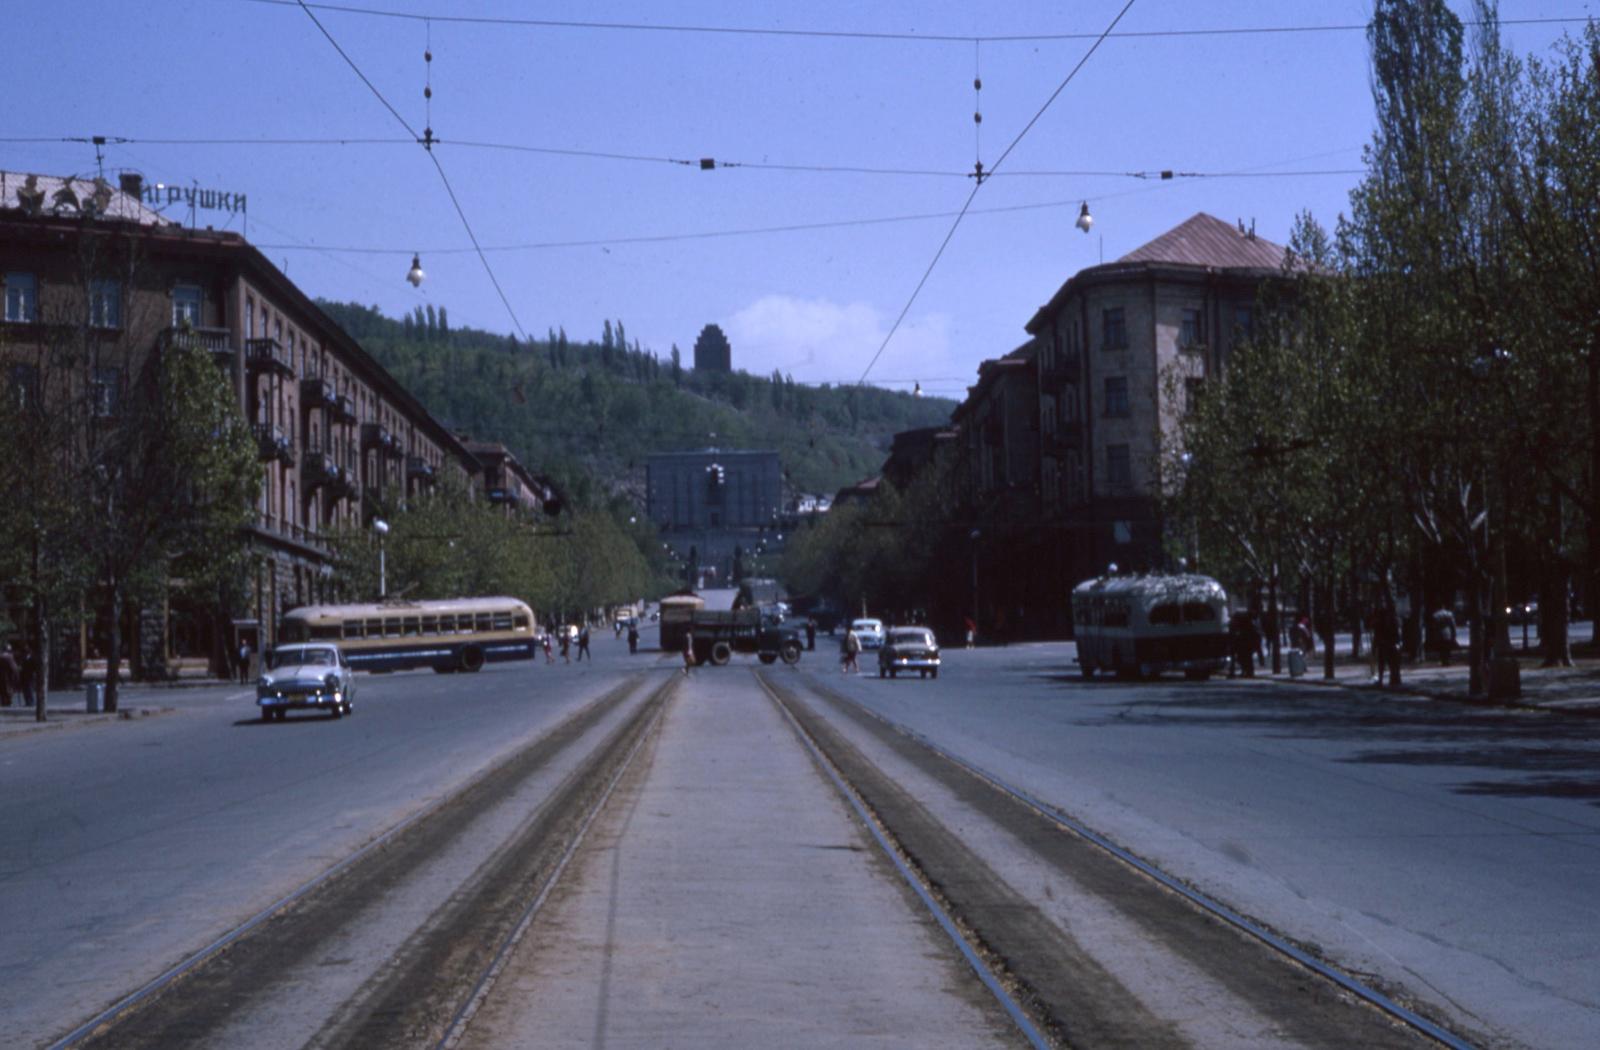
1964. Today's Mashtots Avenue at the crossing with Moskovyan Street, another of Thomas Hammond's slides. The avenue has tram tracks, a trolleybus and a few cars; in 1980 an economist would count more than 70,000 motor vehicles in the city.
Photo: Thomas Taylor Hammond / University of Virginia CREEES · Wikimedia Commons · CC BY-SA 4.0
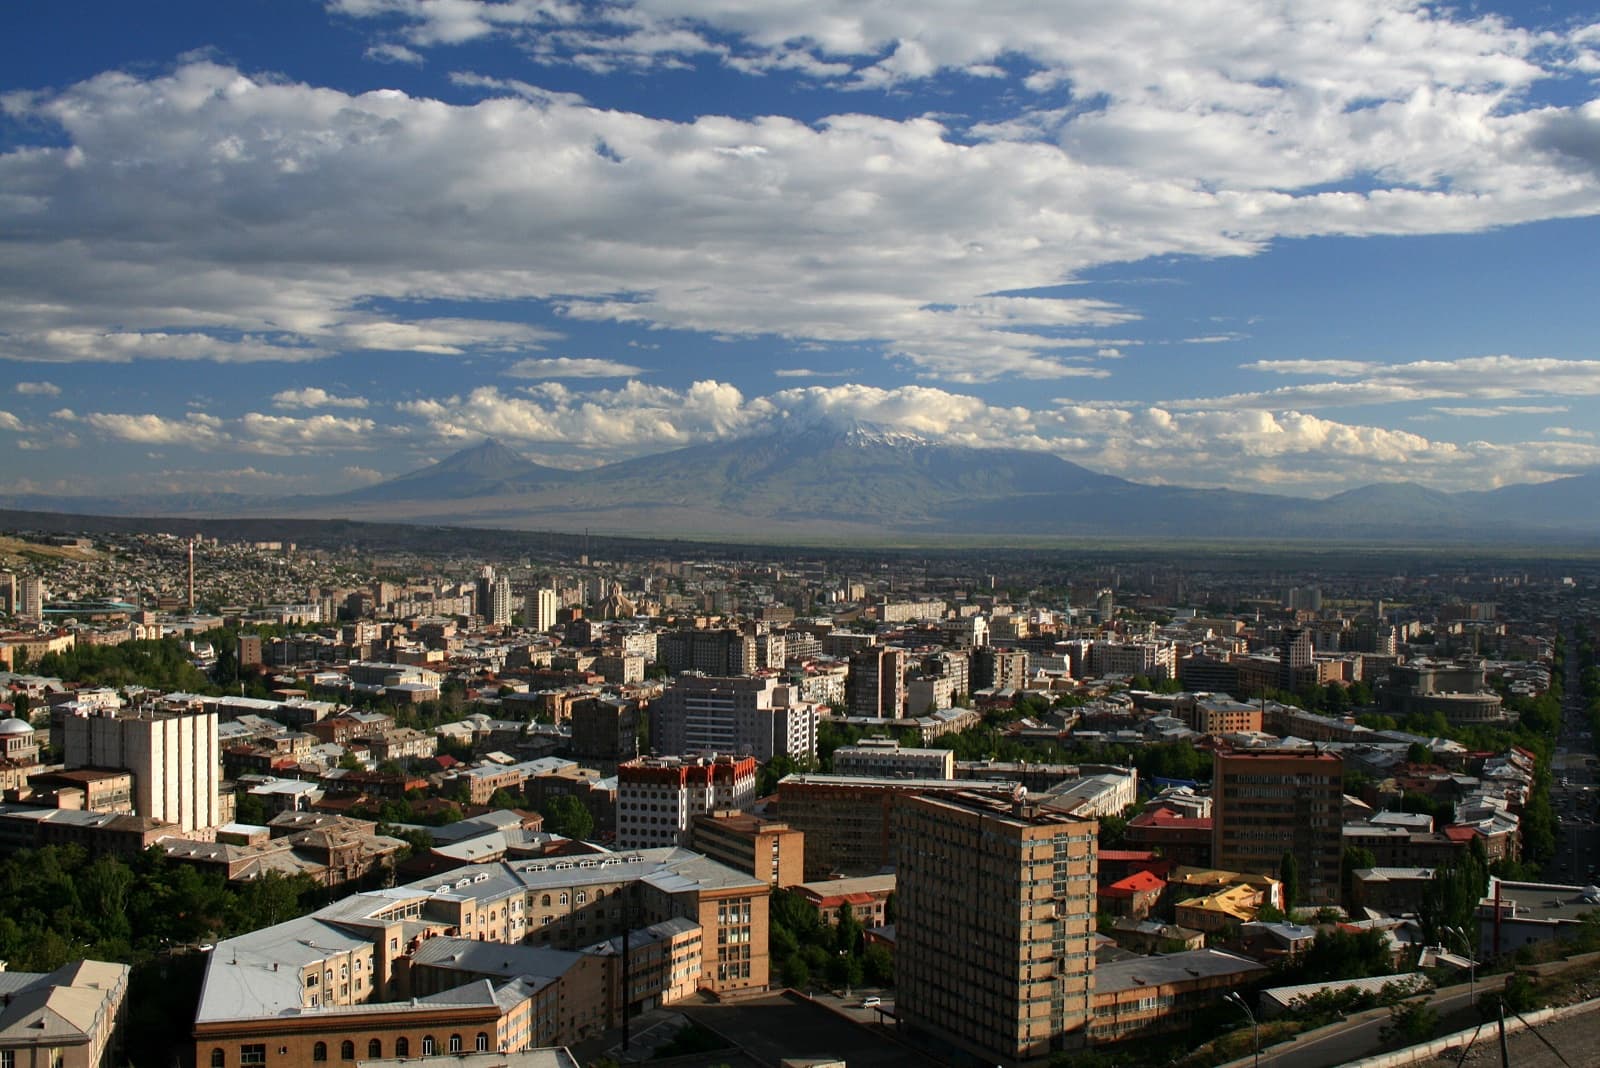
15 June 2008. The view from the Mother Armenia monument in Victory Park, the park the 1964 and 2024 frames were taken from. Ararat is visible, with light haze over the plain.
Photo: David Sullivan · Wikimedia Commons · Public domain
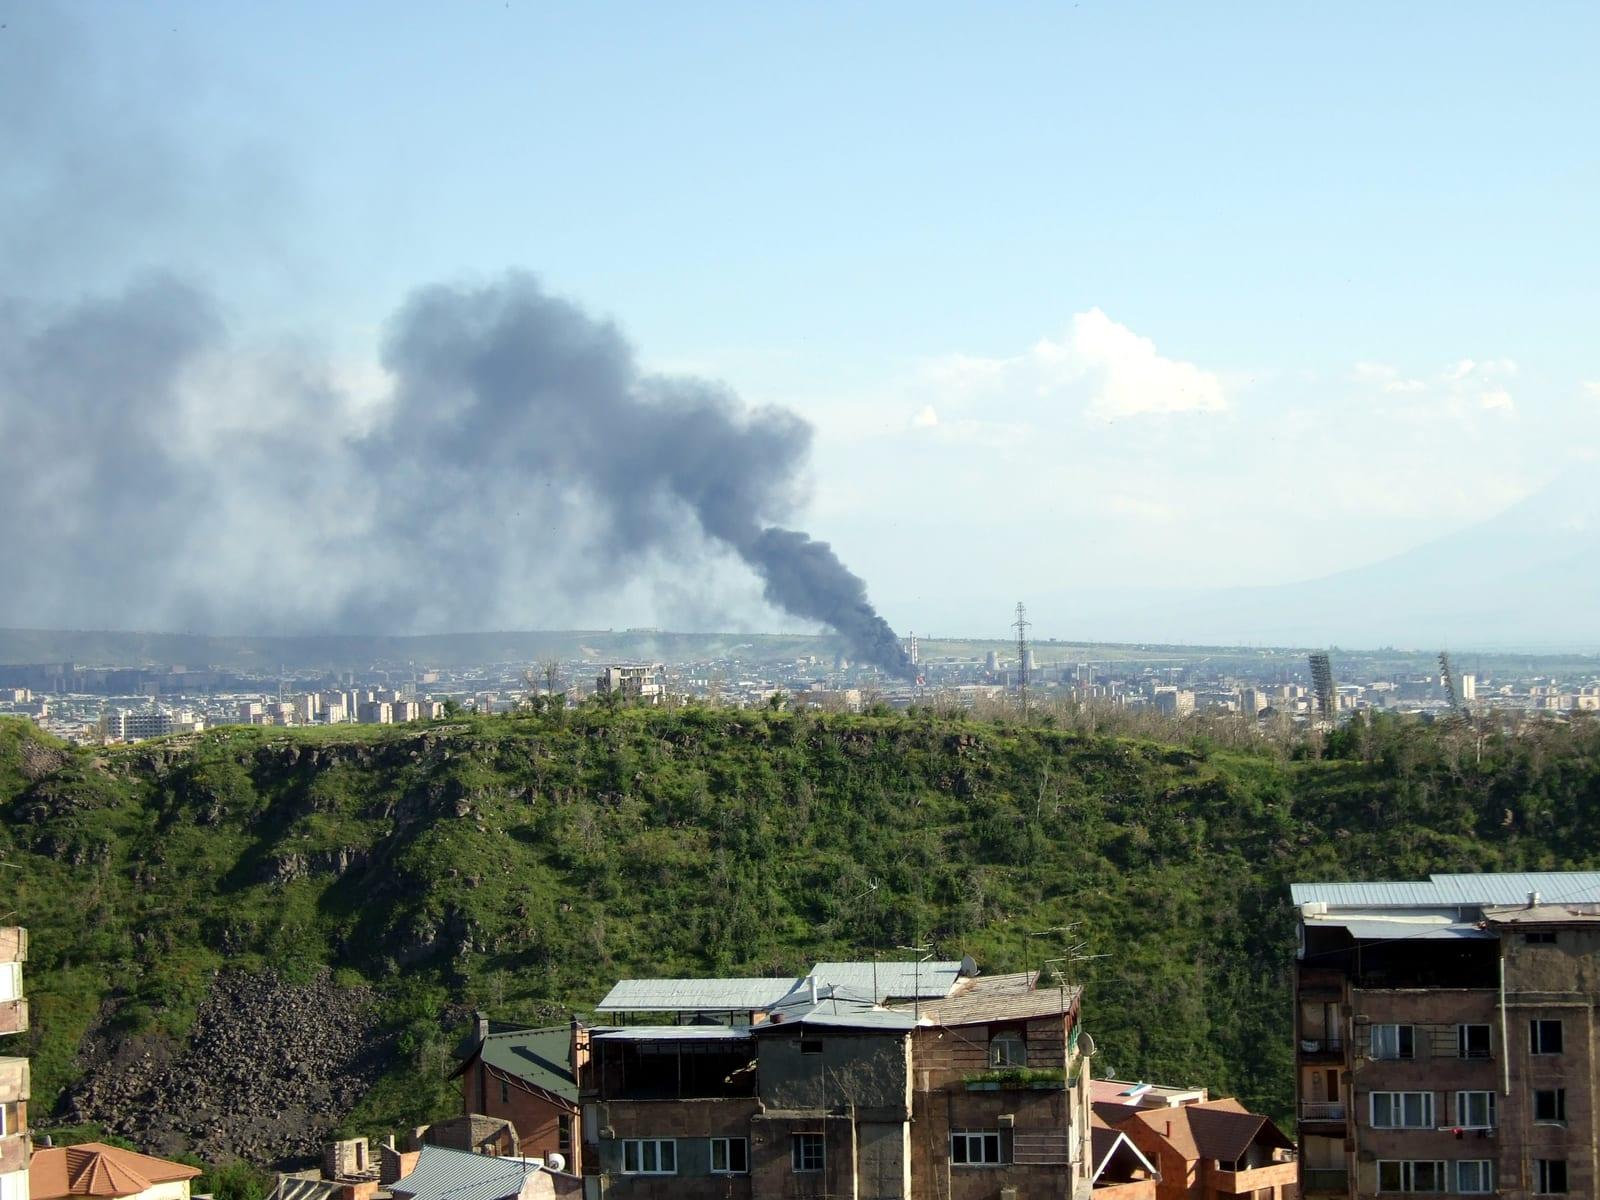
14 May 2009. Smoke over Nairit on the day of the explosions at the plant.
Photo: Chaojoker · Wikimedia Commons · CC BY-SA 3.0
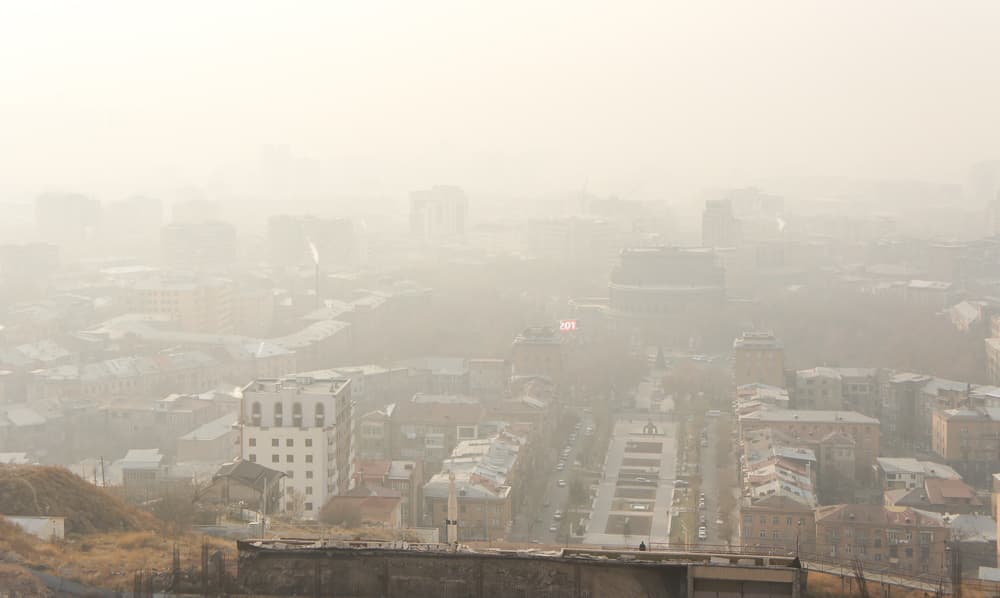
30 December 2010, 10:21. The view from the Cascade over Tamanyan Park and the Opera. The photographer titled the frame 'Morning haze above winter Yerevan'; of the districts beyond the Opera only silhouettes show.
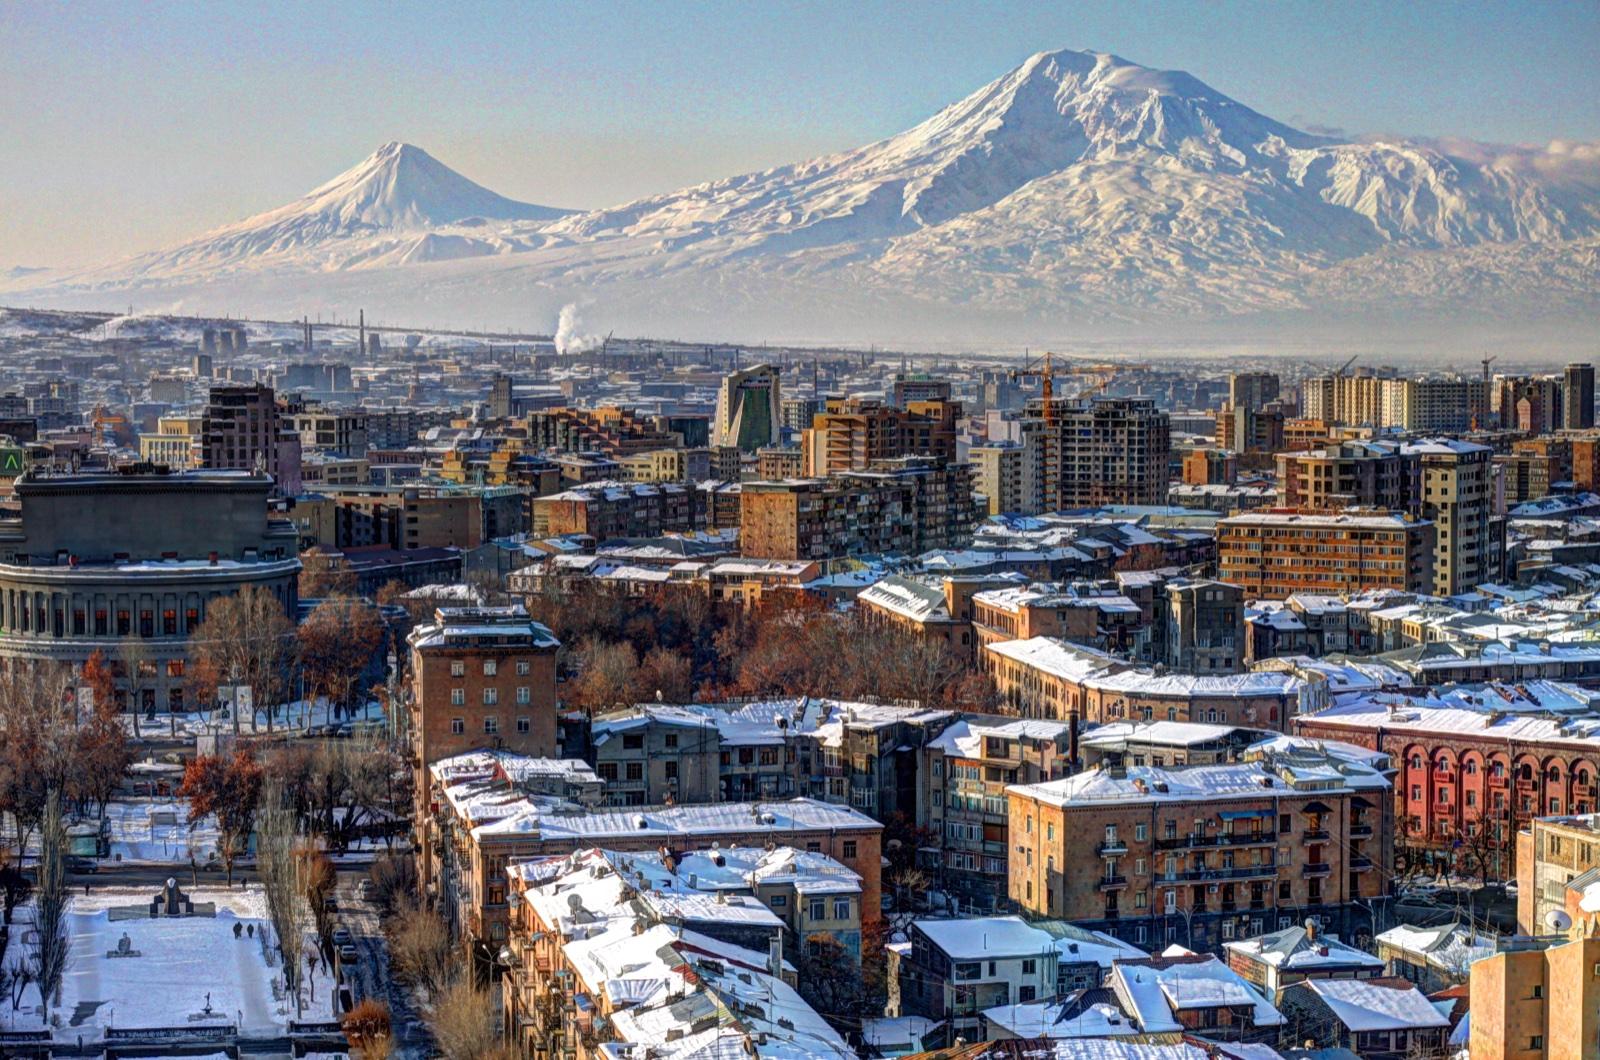
20 February 2012, 9:20. The city center, with the Opera on the left, and Ararat. The mountain is visible in full, while a pale band lies over the plain at its foot, with a white column of steam or smoke rising out of it.
Photo: Serouj Ourishian · Wikimedia Commons · CC BY-SA 3.0
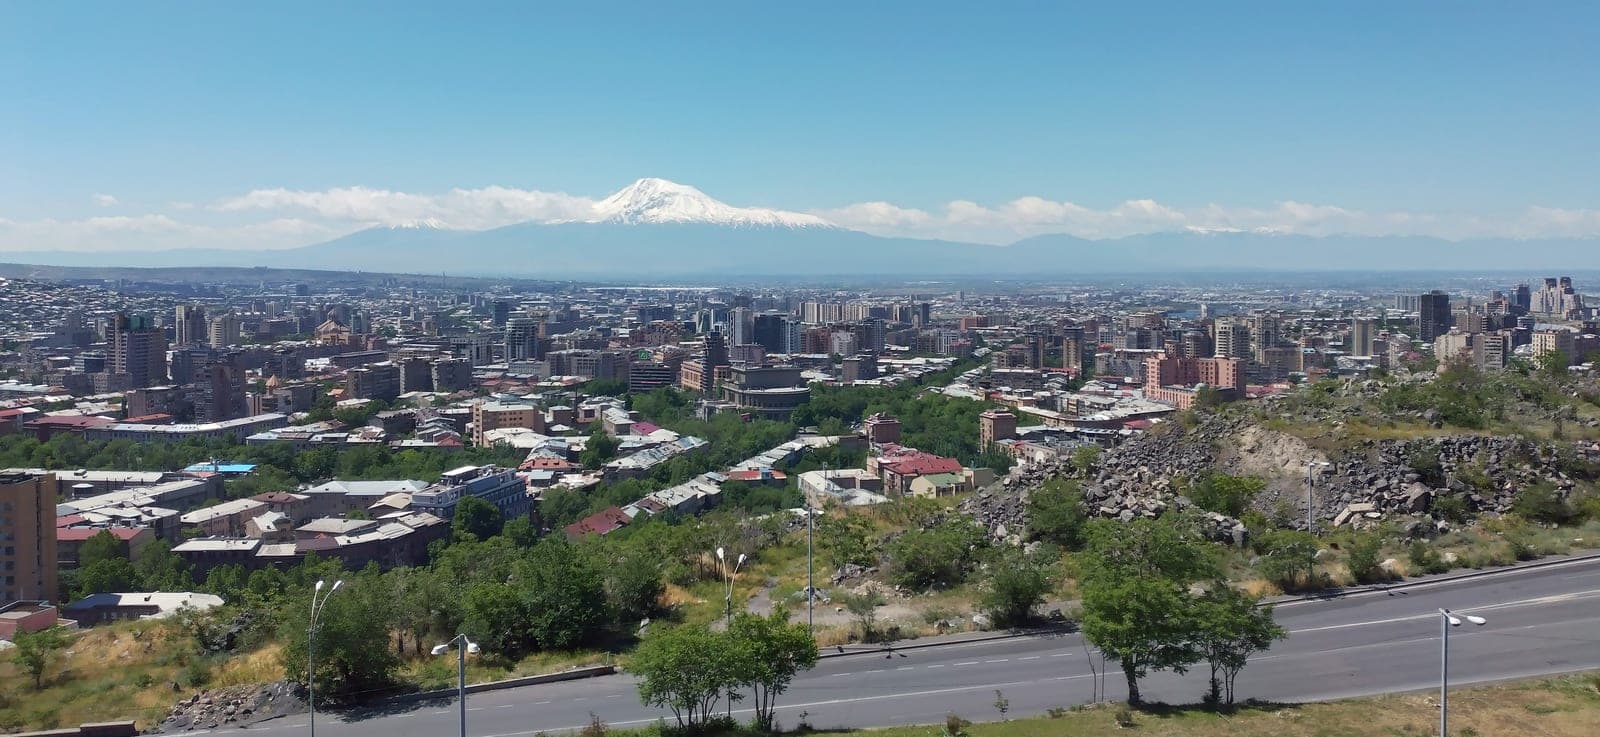
18 May 2024. The view south-southwest from Victory Park toward the Opera: clear, with Ararat in the distance. The photograph at the top of this page was taken from the same park exactly a year later.
Photo: Yuri Samoylov · Wikimedia Commons · CC BY-SA 4.0
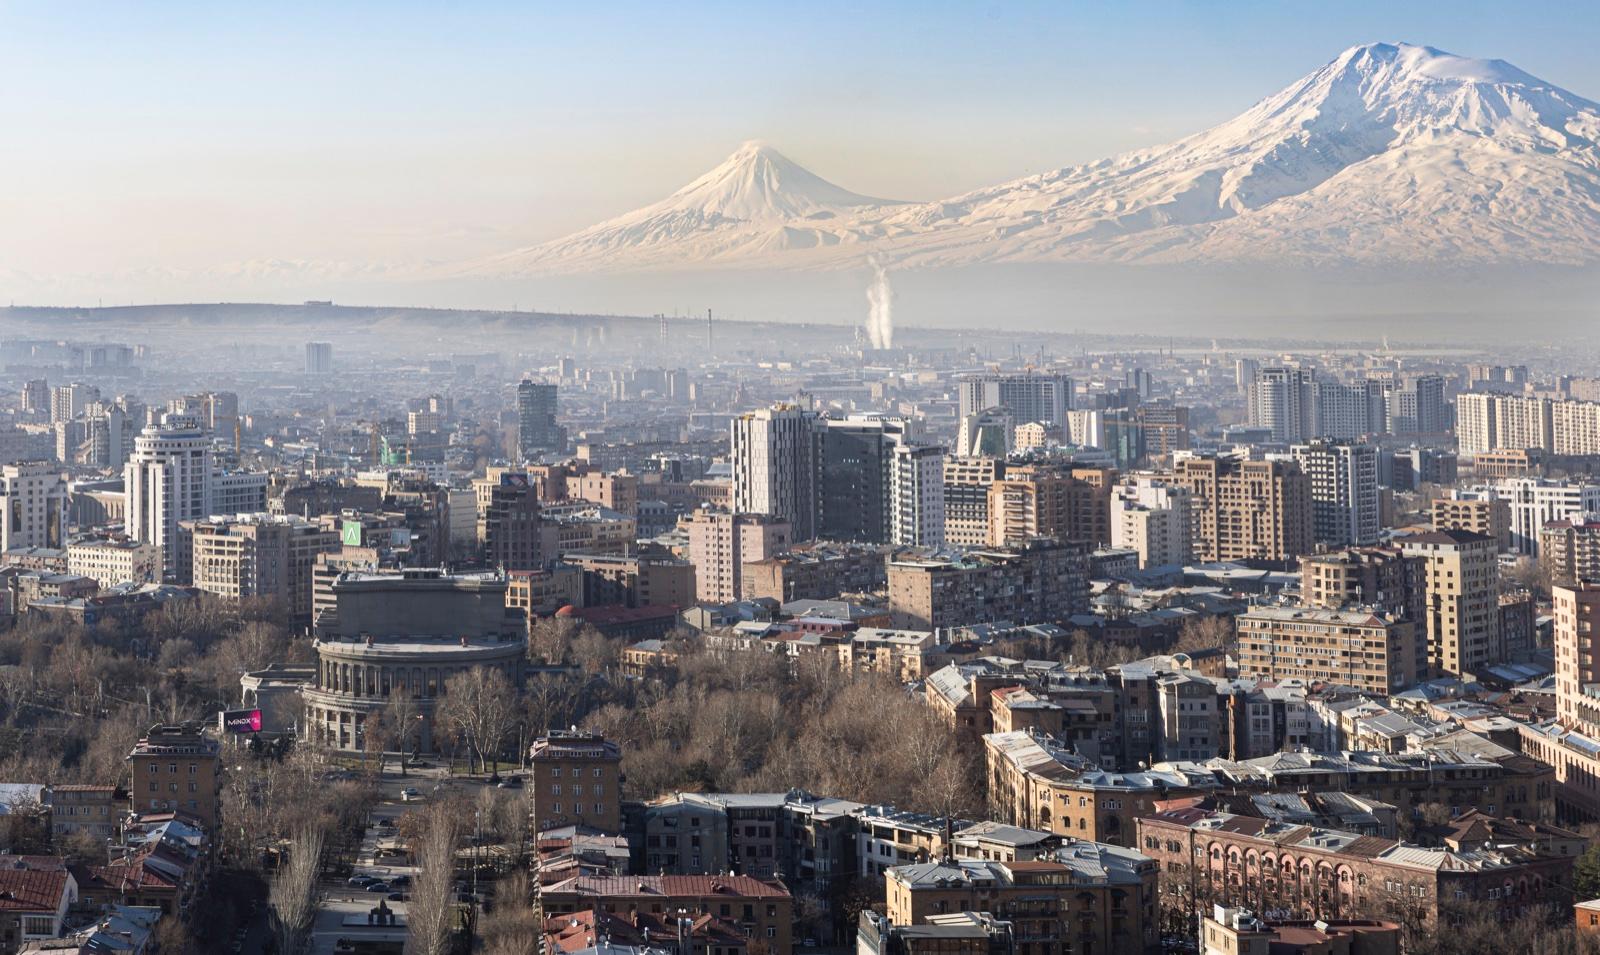
11 March 2026, 9:02. The Opera is again in the left foreground, and there are more high-rise buildings. A grey-brown band lies over the south of the city and the plain, with the clear slopes of Ararat above it.
Photo: David Castor · Wikimedia Commons · CC0 1.0
The air in long series
Fine particles have been measured in Yerevan since 2019. Indirect series speak for the earlier years: visibility at weather stations, the state network's dust and a satellite-derived estimate. We do not join them into one line, because they measure different things.
Afternoon visibility in Yerevan, 1950-1992
At the weather station in Arabkir an observer wrote down, several times a day, how far away landmarks could be made out. The chart shows the share of 4 p.m. observations with visibility of 20 km or more. Observations at 90% humidity or above are left out, so that fog is not counted as haze.
Averaged over the 1950s, 80% of these observations were clear; over the 1980s, 26%.
Afternoon visibility in Yerevan, 1950-1992
Share of clear 4 p.m. observations, %
This is one station and a judgment by eye in a few classes. Dust and moisture also make haze, so the series speaks of how clear the air was and not of pollutant concentrations. From 1994 the same station number carries airport-style reports that cap visibility near 10 km, so the series ends in 1992.
Data: NOAA Integrated Surface Database, station Yerevan Arabkir, 37789099999.
Source: NOAA Integrated Surface Database
yfp.am/en/topics/air-pollution#visibility-chart
 Yerevan for People
All years (41)
| Year | Observations | Clear, % |
|---|---|---|
| 1950 | 276 | 79 |
| 1951 | 228 | 81 |
| 1952 | 310 | 79 |
| 1953 | 261 | 77 |
| 1954 | 280 | 77 |
| 1955 | 301 | 90 |
| 1956 | 291 | 81 |
| 1957 | 302 | 80 |
| 1958 | 308 | 84 |
| 1959 | 261 | 78 |
| 1960 | 195 | 71 |
| 1961 | 255 | 72 |
| 1962 | 218 | 70 |
| 1963 | 237 | 68 |
| 1964 | 292 | 55 |
| 1965 | 339 | 63 |
| 1966 | 357 | 60 |
| 1967 | 352 | 56 |
| 1968 | 346 | 64 |
| 1969 | 351 | 59 |
| 1970 | 353 | 67 |
| 1973 | 330 | 53 |
| 1974 | 324 | 44 |
| 1975 | 337 | 45 |
| 1976 | 324 | 40 |
| 1977 | 340 | 36 |
| 1978 | 336 | 38 |
| 1979 | 348 | 38 |
| 1980 | 346 | 36 |
| 1981 | 338 | 33 |
| 1982 | 324 | 21 |
| 1983 | 330 | 28 |
| 1984 | 310 | 13 |
| 1985 | 336 | 25 |
| 1986 | 328 | 13 |
| 1987 | 316 | 26 |
| 1988 | 321 | 31 |
| 1989 | 330 | 32 |
| 1990 | 337 | 30 |
| 1991 | 324 | 19 |
| 1992 | 194 | 36 |
Afternoon visibility at Zvartnots airport, 2002-2023
NOAA's database holds reports with visibility judged by eye for one more station: Zvartnots airport on the plain, about 11 km west of the city center. The method is the same: 4 p.m. observations, 20 km or more, humidity below 90%.
In 2002-2023 the share of clear observations stayed between 62% and 75%: 69% on average in the first five years and 71% in the last five.
Afternoon visibility at Zvartnots airport, 2002-2023
Share of clear 4 p.m. observations, %
This series cannot be spliced onto Arabkir's: the stations are 14 km apart, the series nine years apart, and almost every airport record falls into four classes: 2, 4, 10 and 50 km, so 'clear' here nearly always means '50 km'. The airport lies outside the city, and at 4 p.m. the air is better mixed than at night and in the morning, when winter smog holds. The series says nothing about whether particle levels in the city rose. The reports end on 1 June 2024.
Data: NOAA Integrated Surface Database, station Yerevan Zvartnots, 37788099999, 35394699999.
Source: NOAA Integrated Surface Database
yfp.am/en/topics/air-pollution#airport-visibility-chart
Yerevan for PeopleAll years (22)
| Year | Observations | Clear, % |
|---|---|---|
| 2002 | 335 | 67 |
| 2003 | 334 | 64 |
| 2004 | 347 | 72 |
| 2005 | 324 | 72 |
| 2006 | 336 | 70 |
| 2007 | 341 | 67 |
| 2008 | 339 | 62 |
| 2009 | 348 | 67 |
| 2010 | 346 | 64 |
| 2011 | 337 | 63 |
| 2012 | 341 | 70 |
| 2013 | 352 | 64 |
| 2014 | 349 | 68 |
| 2015 | 354 | 67 |
| 2016 | 357 | 70 |
| 2017 | 343 | 70 |
| 2018 | 357 | 73 |
| 2019 | 360 | 69 |
| 2020 | 355 | 70 |
| 2021 | 345 | 72 |
| 2022 | 353 | 75 |
| 2023 | 353 | 71 |
Dust in Yerevan as the state network reports it, since 1990
The Statistical Committee publishes the annual mean dust concentration at three Yerevan stations of the state network; the table does not say which stations they are. This is all suspended dust with no split by particle size, and it cannot be compared with PM2.5. The dashed line is the daily mean limit, 150 µg/m³.
Values change severalfold between adjacent years: station 2 is recorded at 50 µg/m³ in 2010 and 423 in 2011. The table does not explain such jumps, so we draw no trend from this series.
In 2024 the annual means at the stations were 97 to 130 µg/m³, below the line. The line, though, marks the daily limit, and in the same year it was exceeded on 55 to 93 days at each station. For 1990 the table records 300 to 900 µg/m³.
Dust in Yerevan as the state network reports it, since 1990
Dust, µg/m³ as an annual mean
Data: Statistical Committee of Armenia, table EE-a2, 'Ambient air quality in urban areas', citing the Hydrometeorology and Monitoring Center. The table names its unit 'mg/m3' but prints the limit as 150; the government decision sets it at 0.15 mg/m³, and the center's annual review for 2024 gives values of the same size in µg/m³. The values are in micrograms.
Sources: Statistical Committee of Armenia, Hydrometeorology and Monitoring Center
yfp.am/en/topics/air-pollution#dust-chart
Yerevan for PeopleAll years (27)
Mean; days above the limit in brackets
| Year | Station 1 | Station 2 | Station 3 |
|---|---|---|---|
| 1990 | 300 | 900 | 400 |
| 1995 | 400 | ||
| 2000 | 300 | 800 | 800 |
| 2001 | 600 | 400 | |
| 2002 | 300 | 500 | |
| 2003 | 600 | ||
| 2004 | 400 | ||
| 2005 | 300 | ||
| 2006 | 90 | 140 | 480 |
| 2007 | 60 | 160 | 370 |
| 2008 | 60 | 150 | 210 |
| 2009 | 50 | 70 | 140 |
| 2010 | 30 | 50 | 140 |
| 2011 | 186 (113) | 423 (152) | 142 (78) |
| 2012 | 248 (139) | 321 (165) | 412 (177) |
| 2013 | 251 (175) | 277 (169) | 210 (124) |
| 2014 | 90 (74) | 88 (61) | 65 (43) |
| 2015 | 74 (17) | 72 (17) | 53 (9) |
| 2016 | 108 (63) | 109 (51) | 74 (46) |
| 2017 | 148 (140) | 115 (78) | 95 (27) |
| 2018 | 126 (119) | 123 (110) | 76 (27) |
| 2019 | 120 (67) | 163 (131) | 97 (58) |
| 2020 | 124 (39) | 89 (35) | 114 (55) |
| 2021 | 106 (45) | 106 (156) | 148 (76) |
| 2022 | 109 (54) | 108 (76) | 130 (87) |
| 2023 | 104 (70) | 116 (81) | 137 (105) |
| 2024 | 106 (58) | 97 (55) | 130 (93) |
Fine PM2.5 particles in Yerevan since 1998
The line is Washington University's estimate, calculated from satellite images and an atmospheric model for the 12 grid cells over the city. The dots are yearly means from the airquality.am sensor network. The dashed line is the WHO guideline, 5 µg/m³ as an annual mean.
In the years they share, the satellite estimate is 18-58% above the sensors. We found no published reference PM2.5 series for a full year in Yerevan; the U.S. embassy monitor read higher than the sensors on the days it has data for (the last chart). Both series are above the WHO guideline in every year, by 4.1 to 7.6 times.
Fine PM2.5 particles in Yerevan since 1998
PM2.5, µg/m³ as an annual mean
The rise of the satellite line is calculated by a model; by its authors' account the dataset is meant for studies of large areas. The sensor network kept growing, from 23 to 140 stations since January 2024 alone, so its years cannot be compared directly either. An annual mean hides the winter peaks.
airquality.am's review of 2025 gives 28 µg/m³ and 214 days above the daily guideline. From the file of daily means it publishes we get 29.2 and 228; the review does not say how its stations were averaged.
Data: Atmospheric Composition Analysis Group, Washington University, V5.GL.05.02 (van Donkelaar et al., 2021), CC BY 4.0; airquality.am, DbCL 1.0.
Sources: Washington University ACAG, airquality.am
yfp.am/en/topics/air-pollution#particles-chart
Yerevan for PeopleAll years (28)
| Year | Satellite-derived estimate | Sensor network | Days with data | Days above 15 µg/m³ |
|---|---|---|---|---|
| 1998 | 20.7 | |||
| 1999 | 20.6 | |||
| 2000 | 25.0 | |||
| 2001 | 25.2 | |||
| 2002 | 27.0 | |||
| 2003 | 26.7 | |||
| 2004 | 27.3 | |||
| 2005 | 28.5 | |||
| 2006 | 30.0 | |||
| 2007 | 27.1 | |||
| 2008 | 32.8 | |||
| 2009 | 27.8 | |||
| 2010 | 33.1 | |||
| 2011 | 27.9 | |||
| 2012 | 28.3 | |||
| 2013 | 30.2 | |||
| 2014 | 33.3 | |||
| 2015 | 33.3 | |||
| 2016 | 30.5 | |||
| 2017 | 32.2 | |||
| 2018 | 33.7 | |||
| 2019 | 35.9 | 20.6 | 334 | 92 |
| 2020 | 33.2 | 24.3 | 366 | 156 |
| 2021 | 38.2 | 32.5 | 365 | 170 |
| 2022 | 34.8 | 23.4 | 365 | 133 |
| 2023 | 34.1 | 21.6 | 365 | 141 |
| 2024 | 24.4 | 366 | 184 | |
| 2025 | 29.2 | 365 | 228 |
PM2.5 in Yerevan: the U.S. embassy monitor and the sensor network
In the U.S. AirNow system's daily files from January 2019 to October 2026, the Department of State monitor at the embassy in the south-west of Yerevan appears only between November 15, 2022 and April 20, 2023: 118 days with a daily mean PM2.5. The longest gap inside that stretch runs from December 23, 2022 to January 23, 2023. The second line is the airquality.am sensor network's city mean for the same days.
Over 118 shared days the monitor averaged 43.5 µg/m³ and the sensor network 25.0, 42% less. The two move together: the correlation coefficient is 0.92. On the dirtiest day, December 16, 2022, the monitor read 209.9 µg/m³ and the network 100.1.
PM2.5 in Yerevan: the U.S. embassy monitor and the sensor network
PM2.5, µg/m³ as a daily mean
The monitor stands at one point while the network averages sensors across districts, so part of the difference may come from the place; the comparison does not measure the sensors' accuracy. AirNow calls its data preliminary: they have not been validated. The files do not name the instrument.
Data: U.S. Department of State and the AirNow program of the U.S. Environmental Protection Agency, preliminary; airquality.am, DbCL 1.0.
Sources: U.S. Department of State, AirNow, airquality.am
yfp.am/en/topics/air-pollution#monitor-chart
Yerevan for PeopleAll days (118)
| Day | Embassy monitor | Sensor network |
|---|---|---|
| November 15, 2022 | 23.8 | 17.9 |
| November 16, 2022 | 59.6 | 24.3 |
| November 17, 2022 | 75.2 | 32.3 |
| November 18, 2022 | 53.3 | 21.4 |
| November 19, 2022 | 51.6 | 18.9 |
| November 20, 2022 | 64.5 | 26.0 |
| November 21, 2022 | 74.9 | 30.3 |
| November 22, 2022 | 110.5 | 48.3 |
| November 23, 2022 | 105.5 | 35.4 |
| November 24, 2022 | 83.2 | 32.8 |
| November 25, 2022 | 77.7 | 29.2 |
| November 26, 2022 | 79.1 | 34.7 |
| November 27, 2022 | 26.6 | 10.1 |
| November 28, 2022 | 37.9 | 14.4 |
| November 29, 2022 | 71.7 | 25.3 |
| November 30, 2022 | 98.3 | 56.2 |
| December 1, 2022 | 96.9 | 63.0 |
| December 2, 2022 | 31.0 | 15.9 |
| December 3, 2022 | 48.9 | 26.2 |
| December 4, 2022 | 19.0 | 8.3 |
| December 5, 2022 | 19.2 | 9.1 |
| December 6, 2022 | 44.6 | 19.7 |
| December 7, 2022 | 77.5 | 36.6 |
| December 8, 2022 | 67.9 | 41.1 |
| December 9, 2022 | 78.6 | 40.3 |
| December 10, 2022 | 75.8 | 39.0 |
| December 11, 2022 | 44.7 | 19.1 |
| December 12, 2022 | 47.5 | 24.7 |
| December 13, 2022 | 84.1 | 46.1 |
| December 14, 2022 | 115.1 | 63.6 |
| December 15, 2022 | 166.6 | 86.9 |
| December 16, 2022 | 209.9 | 100.1 |
| December 17, 2022 | 202.0 | 73.8 |
| December 18, 2022 | 118.7 | 60.1 |
| December 19, 2022 | 87.4 | 41.1 |
| December 20, 2022 | 66.5 | 28.7 |
| December 21, 2022 | 84.2 | 35.5 |
| December 22, 2022 | 104.8 | 51.4 |
| January 24, 2023 | 27.6 | 39.7 |
| January 25, 2023 | 66.3 | 43.6 |
| January 26, 2023 | 72.6 | 48.2 |
| January 27, 2023 | 78.3 | 51.3 |
| February 4, 2023 | 26.1 | 16.9 |
| February 5, 2023 | 32.8 | 37.1 |
| February 6, 2023 | 58.8 | 55.4 |
| February 7, 2023 | 18.5 | 12.3 |
| February 8, 2023 | 12.3 | 12.1 |
| February 9, 2023 | 20.0 | 18.7 |
| February 10, 2023 | 28.5 | 22.6 |
| February 11, 2023 | 36.4 | 31.1 |
| February 12, 2023 | 39.1 | 31.1 |
| February 13, 2023 | 37.6 | 32.3 |
| February 14, 2023 | 14.7 | 14.0 |
| February 15, 2023 | 40.8 | 24.2 |
| February 16, 2023 | 30.4 | 21.4 |
| February 17, 2023 | 19.3 | 16.1 |
| February 18, 2023 | 34.2 | 20.5 |
| February 19, 2023 | 47.2 | 23.0 |
| February 20, 2023 | 25.9 | 19.5 |
| February 21, 2023 | 15.1 | 15.1 |
| February 22, 2023 | 14.1 | 10.8 |
| February 23, 2023 | 19.4 | 13.9 |
| February 24, 2023 | 12.0 | 9.6 |
| February 25, 2023 | 31.8 | 19.9 |
| February 26, 2023 | 70.2 | 39.1 |
| February 27, 2023 | 66.2 | 45.6 |
| February 28, 2023 | 51.1 | 36.7 |
| March 1, 2023 | 61.4 | 45.0 |
| March 2, 2023 | 49.5 | 31.8 |
| March 3, 2023 | 36.5 | 24.0 |
| March 4, 2023 | 55.1 | 32.8 |
| March 5, 2023 | 42.8 | 19.9 |
| March 6, 2023 | 25.6 | 12.6 |
| March 7, 2023 | 8.9 | 9.0 |
| March 8, 2023 | 30.7 | 17.1 |
| March 9, 2023 | 32.3 | 19.9 |
| March 10, 2023 | 45.5 | 32.9 |
| March 11, 2023 | 28.4 | 19.9 |
| March 12, 2023 | 27.7 | 17.0 |
| March 13, 2023 | 27.7 | 16.2 |
| March 14, 2023 | 26.4 | 15.7 |
| March 15, 2023 | 20.7 | 15.1 |
| March 16, 2023 | 14.3 | 11.2 |
| March 17, 2023 | 13.2 | 17.7 |
| March 18, 2023 | 20.9 | 22.7 |
| March 19, 2023 | 23.3 | 15.5 |
| March 20, 2023 | 12.8 | 9.7 |
| March 21, 2023 | 20.1 | 11.8 |
| March 22, 2023 | 11.0 | 9.6 |
| March 23, 2023 | 21.0 | 14.3 |
| March 24, 2023 | 22.5 | 15.9 |
| March 25, 2023 | 21.7 | 16.1 |
| March 26, 2023 | 26.8 | 17.3 |
| March 27, 2023 | 12.8 | 10.1 |
| March 28, 2023 | 13.4 | 10.7 |
| March 29, 2023 | 11.6 | 9.1 |
| March 30, 2023 | 10.2 | 7.7 |
| March 31, 2023 | 10.3 | 8.1 |
| April 1, 2023 | 13.3 | 13.3 |
| April 2, 2023 | 59.4 | 33.5 |
| April 3, 2023 | 13.8 | 10.7 |
| April 4, 2023 | 15.1 | 10.8 |
| April 5, 2023 | 16.9 | 11.1 |
| April 6, 2023 | 11.9 | 8.6 |
| April 7, 2023 | 6.5 | 6.4 |
| April 8, 2023 | 9.8 | 7.0 |
| April 9, 2023 | 10.6 | 8.7 |
| April 10, 2023 | 17.3 | 13.2 |
| April 11, 2023 | 35.8 | 31.9 |
| April 12, 2023 | 15.0 | 12.3 |
| April 13, 2023 | 4.4 | 5.5 |
| April 14, 2023 | 7.3 | 7.6 |
| April 15, 2023 | 14.1 | 11.3 |
| April 16, 2023 | 14.5 | 11.1 |
| April 17, 2023 | 14.8 | 13.5 |
| April 18, 2023 | 14.4 | 12.2 |
| April 19, 2023 | 8.2 | 7.4 |
| April 20, 2023 | 11.0 | 8.9 |
Data retrieved: October 11, 2026
Promises & what happened
- Tigran Avinyan — Mayor of Yerevan, Yerevan MunicipalityPartial
«Draft, within two months, a four-year plan of measures to reduce air pollution: tree planting with concrete indicators, and restrictions, for example on ageing vehicles.»
The programme was reported to the mayor on 10 February 2025, on time. Budgets and schedules were promised for later and had not been shown by September 2026. Tighter control of vehicle emissions and the removal of the dirtiest cars are marked 'planned' in City Hall's reply.
- Gorik Avetisyan — Deputy head of Yerevan City Hall's nature protection department, Yerevan MunicipalityBroken
«The final programme will be presented in September, and the measures will be carried out from 2026.»
A year on, in September 2026, City Hall answered a direct request with neither a text carrying budgets and dates nor a stage-by-stage report.
- Ministry of Environment of Armenia — Responsible for air protection policy and state monitoringBroken
«Two automatic observation stations will be installed in Yerevan in the first quarter of 2025; they will show pollution in real time, fine particles included.»
By the ministry's reply of September 2026, both stations have been on trial since January 2026; it does not say when the PM2.5 and PM10 data will be opened.
- Government of Armenia, Ministry of Environment of Armenia — Responsible for air protection policy and state monitoringBroken
«Prepare proposals on digitizing measurements at vehicle inspection, re-equipping the stations and electronic control of emission checks.»
The ministry's reply of September 2026 describes studies and discussions; it contains no finished proposals.
- Tigran Avinyan — Mayor of YerevanPartial
«In December the Council of Elders will adopt amendments after which the fine for violations on construction sites rises by tens of times.»
The new amounts have applied since 29 August 2026: 1.5-2 million drams in place of 70-100 thousand. That is about twenty times more, and eight months later than the date given.
- Tigran Avinyan — Mayor of YerevanPending
«Planting evergreen trees over hundreds of hectares will become a natural barrier protecting the capital's air.»
For 2026 the ministry reports work on 2.5 hectares in Yerevan; another 8.5 hectares by the Nubarashen highway are being prepared for planting in autumn.
- Tigran Khachatryan — Deputy Prime Minister of ArmeniaBroken
«The head of the working group reports results to the Prime Minister every 15 days and informs the public widely every month.»
In ten months the government's site has carried one report on the group's sessions, on the first one, held on 18 December 2025. By the end of May 2026 nothing published showed what decisions the group had taken. The reports to the Prime Minister are not published and cannot be checked.
Claims & fact-check
- Gayane Shahnazaryan — Deputy director of the Hydrometeorology and Monitoring CenterUnsubstantiated
«70 percent of pollution in Armenia arises from transport.»
In fact: This is a share of calculated emissions by mass, which is a different thing from what people breathe. By the Norwegian experts' assessment, no complete emission inventory had been made for the country. The World Bank writes that about half of ambient particle pollution in Armenia comes from dust, soil dust included. A model calculation for 2017 published in Nature Communications puts 36% of Armenia's PM2.5 on windblown dust, 13% on agriculture and 9% on road transport; it is a population-weighted countrywide average and does not single out Yerevan. Yerevan's 2024 master plan names three main causes: construction, quarrying and transport. In 2025 Shahnazaryan herself said the center's methods do not allow one source's contribution to be assessed. A share of this kind was named for Yerevan earlier too: in 1980 an economist, by his own calculation, gave motor transport almost two thirds of the pollution. The earliest table we found is in a Norwegian institute's 2010 report, citing the Ministry of Nature Protection: 71% in 1987 and 96-98% in 1998-2005. It is transport's share of the summed tonnes of all substances from industry, energy and transport; the table has no stoves, building sites, quarries or dust raised from the ground. The report's authors called such summing an improper approach to the estimate, adding that it still indicates the large amount of emissions from transport.
Said: November 15, 2022 · EcolurChecked: October 11, 2026Air quality management feasibility study for Yerevan, Armenia: mission report, 1-5 February 2010 — NILU, 2010
Armenia Country Climate and Development Report — World Bank, November 8, 2024
Yerevan's Air Crisis: Inside the Pollution Emergency — EVN Report, December 24, 2025
- Tigran Avinyan — Mayor of YerevanMisleading
«Talk of poor air in Yerevan is a myth: the primary indicator of dust, PM2.5, has for months shown low or the lowest average levels.»
In fact: Media.am checked the statement: PM2.5 is not the only indicator of pollution, and the larger PM10 particles in Yerevan exceeded the set threshold in most cases. Three months later City Hall's own sensors gave a mean index of 140 for December, 'unhealthy for vulnerable groups'.
Said: September 23, 2024 · Media.amChecked: October 11, 2026 - Gorik Avetisyan — Deputy head of Yerevan City Hall's nature protection department, Yerevan MunicipalityMisleading
«The equipment providing the data shown on the ranking website is not professional, and the margin of error can reach 40%.»
In fact: Hetq compared the Clarity devices installed by City Hall with IQAir over the same period: both sources showed pollution above average. By the state center's laboratory data, dust was below the permitted concentration on only 51 days of 2024, and above the limit on every day of the first three weeks of January 2025. The citizen sensors can be checked against the monitor at the U.S. embassy, whose data the U.S. AirNow system published. On 118 days between November 2022 and April 2023 it averaged 43.5 µg/m³ of PM2.5, and the airquality.am sensor network averaged 25.0 on the same days, 42% less. The monitor stands at one point, AirNow data are preliminary and the network has grown since, so the comparison does not measure the accuracy of the sensors; it shows no overstatement.
Said: February 1, 2025 · HetqChecked: October 11, 2026Daily files with data from the U.S. Department of State monitor in Yerevan, November 2022 to April 2023 — AirNow, 2023
- Ruben Grigoryan — Head of environmental hygiene at the Health Ministry's National Center for Disease Control and PreventionMisleading
«Yerevan residents have no cause for concern: air pollution readings are still within permissible limits, and no special measures are needed.»
In fact: The Armenian standards in force set no permissible limit for PM2.5, and in January 2025 a representative of the same center said the Health Ministry cannot assess the effect on health without state PM2.5 measurements. The same day Ecolur reported 118 µg/m³ across the city; the WHO daily guideline is 15. At the same press conference Grigoryan advised keeping windows closed and avoiding physical activity.
Said: November 26, 2025 · Shamshyan.comChecked: October 11, 2026
- Hovhannes Martirosyan — Head of the Environmental Protection and Mining Inspection BodyMisleading
«The results of our oversight show that we do not have a high-pollution problem.»
In fact: At the same press conference he gave his own measurements: of 225 fine-particle measurements in Yerevan in 2025, 5 showed the limit exceeded more than fivefold and another 25 by up to fivefold. By the sensor network's data, over the winter of 2025-2026 the air was worse than the WHO daily guideline on 138 days out of 151.
Said: January 20, 2026 · EcolurChecked: October 11, 2026
Red flags
- Non-disclosure
Asked about the four-year programme's implementation, City Hall provided no stage-by-stage report, no supporting documents and no information on budget or spending.
Indicators
- Days PM2.5 over the WHO limit
- 214days/yr×53 · WHO limit ≤4
The threshold is 15 µg/m³ a day. The count cannot be set directly against earlier years: since January 2024 the sensor network has grown from 23 to 140 stations.
Money
- 300 million AMDBudget allocation
Allocated to the Ministry of Environment to buy two automatic air monitoring stations for Yerevan
- 1.7 million USDGrant
Japan's grant to modernize air quality monitoring stations
September 29, 2025Ministry of Environment of Armenia - 2 million EURGrant
The EU budget of the three-year EU4Clean Air programme: stations, a reference laboratory, a study of pollution sources in Yerevan
August 19, 2026
Connections
- Amplified byTraffic & car dominanceCDIA, starting a transport study for Yerevan in 2021, wrote that transport accounts for 90% of the air pollutants in the city; the announcement gives no method and no list of pollutants. We found no study that has measured what each source adds to Yerevan's air.
- Amplified byTree cuttingCrowns hold dust and give shade. In a Factor TV debate in February 2026, reported by EcoLur, tree cutting was named among the causes of Yerevan's heavy air.
- Amplified byWaste & landfillDuring the dump fires dust in Yerevan ran 1.1-4.7 times over the limit, and landfill gas goes uncaptured on 45 of the 52 hectares.
What we don't know yet
- What the PM2.5 in Yerevan's air consists of, and how much comes from transport, dust, heating and burning. We found no measurements of PM2.5 composition in the air: the Academy of Sciences' geochemists now sample leaves and surfaces, and of the results of their 2021-2024 project we came across only an abstract about one kindergarten. The only source-by-source breakdown of PM2.5 we found is modelled and countrywide: 36% from windblown dust, 9% from road transport. A study of sources in Yerevan is listed in the EU4Clean Air programme launched in August 2026.
- How many people in Yerevan die or fall ill because of the air. The only city estimate we found is modelled: about 960 premature deaths from PM2.5 in 2019. It is built on satellite-derived concentrations and on disease rates for the country as a whole. We found no calculation from the city's own health statistics and no estimates of illness. The American University of Armenia presented its own model for Yerevan in April 2026, with no published results. The UNDP programme document notes that without data on particle concentrations the Health Ministry cannot calculate mortality.
- Whether Soviet Yerevan's air was cleaner or dirtier in fine particles. PM2.5 was not measured then. As late as 2010 dust was still counted with Soviet-era instruments: three twenty-minute samples a day, particles larger than 0.95 microns. Such data cannot be compared with PM2.5 or PM10, and we did not find how or when the method changed afterwards.
- What the monitoring posts recorded year by year in the 1960s-1980s. We found separate snapshots: dust for 1971-1976 and an all-union table for 1990; the Statistical Committee's table holds 1990 as its only Soviet year. We did not find the Soviet hydrometeorological service's yearbooks of air pollution in cities in digitized form.
- Why the U.S. embassy monitor's data in the AirNow system break off, and what instrument stands there. The last daily value is for 20 April 2023 and the last hourly one for 21 April, while AirNow's list of stations still showed the site as active in October 2026. On the days it has data for, the monitor read higher than the sensor network, and we found no other comparison of the kind.
- What explains the 2011 break in the official series. Dust rose from 30 to 186 µg/m³ at the first station and from 50 to 423 at the second. In the same year mean ozone at the first station fell from 58 to 6 and nitrogen dioxide from 91 to 50, and daily maxima and the number of days over the limit appear in the table for the first time. The Statistical Committee publishes the table with no note on the measurement method.
- Which act approved City Hall's four-year programme, and where its text with a budget and dates is. Among the decisions of the mayor and the Council of Elders published on City Hall's website up to September 2026 we found no such act. Asked directly in September 2026, City Hall did not provide it.
- When the data from the two state stations will be opened. They stand on Yervand Kochar Street and in David Anhaght Park and have been running in test mode since January 2026. The ministry gives no date.
Sources
- On the sanitary protection of atmospheric airЖурнал экспериментальной и клинической медицины АН Армянской ССРarchive · November 1, 2026
- On air pollution in mountain countries in connection with local circulationИзвестия АН Армянской ССР. Науки о Землеarchive · November 1, 2026
- Meteorological conditions of atmospheric pollution over the city of YerevanИзвестия АН Армянской ССР. Науки о Землеarchive · November 1, 2026
- Meteorological conditions of dust in the air of YerevanИзвестия АН Армянской ССР. Науки о Землеarchive · November 1, 2026
- Ecological aspects of city planning in the Armenian SSRВестник общественных наук АН Армянской ССРarchive · November 1, 2026
- Prevalence of chronic bronchitis among the adult population of YerevanАкадемия наук Армянской ССРarchive · November 1, 2026
- On the pollution of winter precipitation in the Armenian SSRИзвестия АН Армянской ССР. Науки о Землеarchive · November 1, 2026
- New data on air pollution in the former Soviet UnionGlobal Environmental Changearchive · January 29, 2026
- Cancer incidence and mortality in a cohort of chloroprene workers from ArmeniaInternational Journal of Cancerarchive · February 3, 2025
- Armenia: Country Fact Sheet on air quality monitoring, 2018-2020European Environment Agencyarchive · October 21, 2026
- Ambient air quality in urban areas: table EE-a2Statistical Committee of Armeniaarchive · November 2, 2026
- Annual review of ambient air quality, 2024Hydrometeorology and Monitoring Centerarchive · June 10, 2026
- Programme (strategy) for improving air quality in the city of YerevanArmenian Global Chroniclearchive · June 9, 2026
- The Air Clears, the Problems Don't: Inside Yerevan's Pollution CrisisArmenian Mirror-Spectatorarchive · March 17, 2026